Science Surveyor
- William Leif Hamilton (Stanford)
- Raine Hoover (Stanford)
- Marguerite Y. Holloway
- Dan Jurafsky (Stanford)
- David Jurgens (Stanford)
- Laura Kurgan (Center for Spatial Research)
- Minkyoung Kim (Stanford)
- Eli Bennett Levin
- Dan McFarland (Stanford)
- Vinodkumar Prabhakaran (Stanford)
- Phillip R. Polefrone
- Juan Francisco Saldarriaga (Center for Spatial Research)
- Dennis Yi Tenen
One of the biggest challenges facing science journalists is the ability to quickly contextualize journal articles they are reporting on deadline. A science reporter must rapidly get a sense of what has come before a new paper in the field, understand whether the paper represents a significant advance or not, and establish whether this finding is an outlier or part of the field’s consensus. Doing all that within a matter of hours or a few days is often impossible. The consequences of these limitations are serious and well documented. Science journalists are often overly dependent on expert sources, which encourages investigative complacency; they become vulnerable to presenting false balance and to covering articles that will be retracted; they sensationalize. As a consequence, the public often receives a mistaken view of science. Many people see science as a series of great new “discoveries” accompanied by a lot of hype; few understand its incremental character, its complexity, its nuance. Americans’ scientific illiteracy is well studied, as is the role of the press in this major societal problem.
Idea
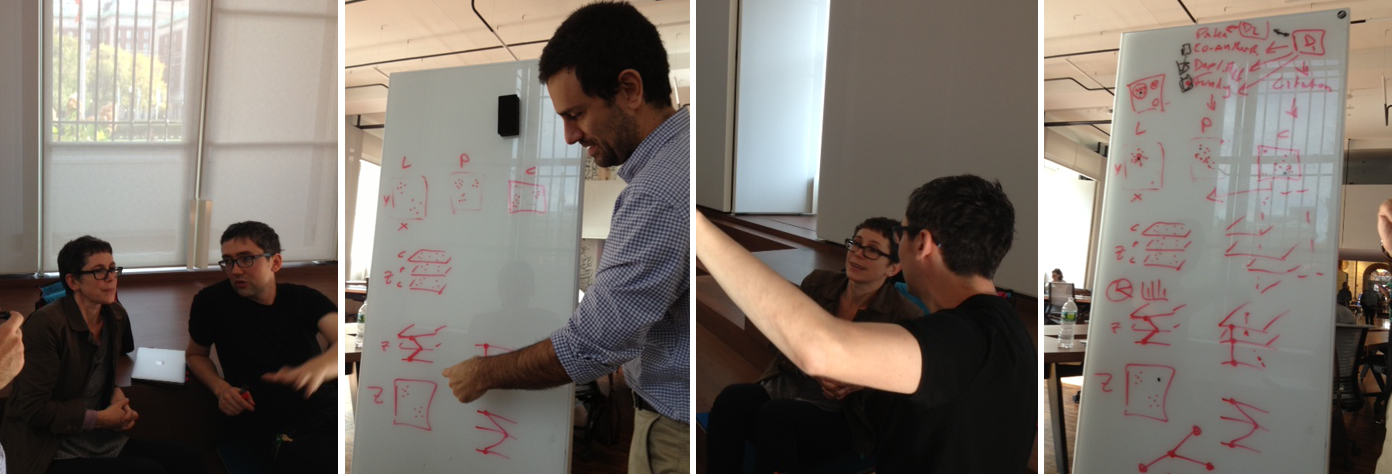
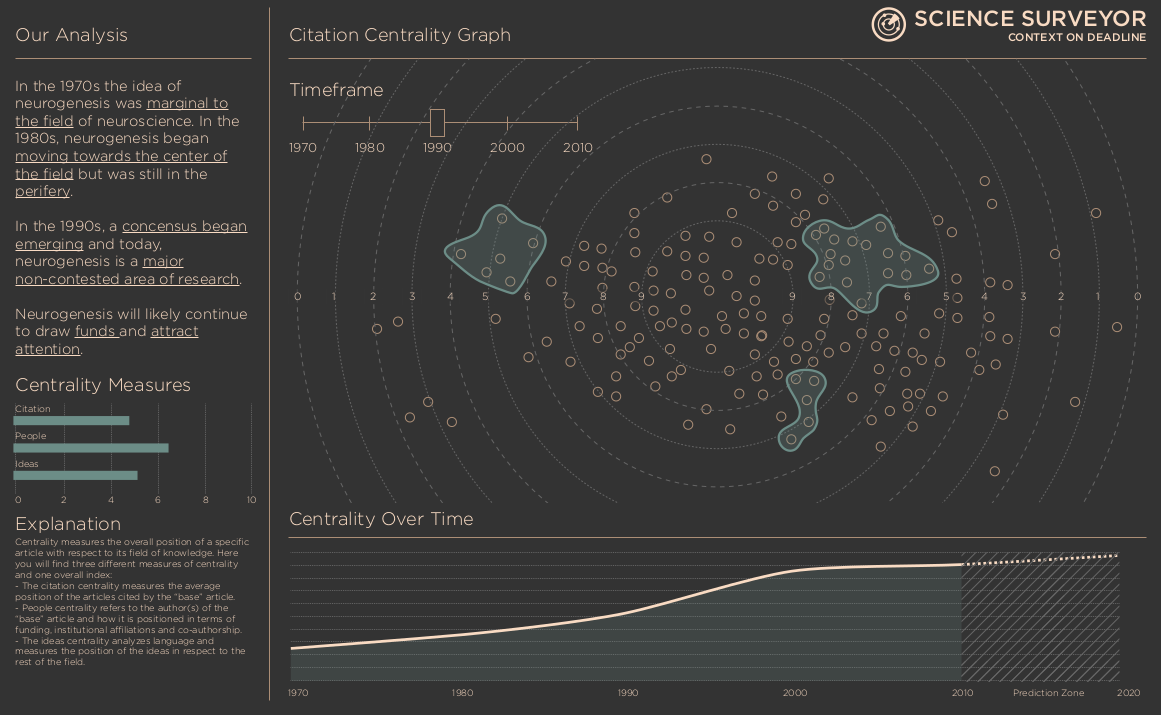
We propose to design a tool that can help science journalists and others to rapidly and effectively characterize the scientific literature for any topic they might cover, as a way to inform and assist news judgment and reporting. The tool, which we are calling Science Surveyor, would allow journalists to submit a scientific study that they want to cover and would generate a map with three central dimensions, or layers: a consensus layer that would show whether the new finding is consistent with scientific consensus, a temporal layer that would show the pattern of publishing on this topic across time, a funding layer that would characterize the funding in that field.
We see such a tool as having the potential to greatly improve science news coverage, making it more independent, contextualized, and investigative. If successful, the tool will have wider uses as well. Scientists and other researchers would use it to improve communication about their fields and practice within their fields. Members of the public would use it to engage with the specialized literature in new ways.
To address these problems, we propose developing a web-based application that answers one crucial question: how does a new finding sit in relation to other findings in the field? We are inspired, in part, by a recent study in which two researchers used citation network analysis to determine emerging scientific consensus. We propose using similar techniques, on a wider scale, to readily visualize the place of new research within the larger field of scientific knowledge.
Plan
We plan to begin development with a prototype of the tool, based on research published in arXiv.org, PLoS One, and/or other similar open access academic repositories. With time, we will broaden the scope of our source materials by negotiating API access with Thomson Reuters, JSTOR, and Elsevier databases. (Several members of our team have close contacts in these organizations.) We will use these data to construct a citation network related to the new published finding. Metrics like centrality and connectivity of new research will provide strong visual indicators of the study’s impact. Marginal studies that use “questionable” sources will appear at the edges of the map. Reputable studies in the context of similar research will appear towards the center, showing strong ties to other “reputable” findings. The markers of quality we are using here—”questionable” and “reputable”—will be formalized using recent advances in methodology from the fields of sociology of knowledge, science and technology studies, and digital epistemology.
The citation map will contain at least two other dimensions, offering further insight about intellectual context. The first is information about funding, which could be displayed as a color overlay or a pop-up bubble. An influx of private corporate funding, for example, could indicate biased results. The second dimension is simply patterns of publication over time. Certain topics tend to “flare up” with public or political interest in the subject. The tool could also track related news items and social media on the topic, providing the reporter with further context about public interest in the subject.
To achieve these goals, we have assembled “a dream team” from Columbia and Stanford with deep expertise in science, technology, scholarly publishing, science journalism, citation network analysis, communication between researchers, the press and the public, and data visualization. Partnering with the Public Knowledge Project at Stanford provides the Science Surveyor team with a visible platform to engage an existing audience inherently invested in the success of the project. Although designed with science journalists in mind and to address a specific set of problems in the profession, the tool could have implications for much wider use and as a means for improving scientific and information literacy at the university and for the public at large.